
De Bruijn graphs - II
In the previous post, we discussed how de Bruijn graphs can be constructed for a genome or a large sequence. Today we will explain, why this method is so popular for genome or transcriptome assembly using short reads. We will also explain why traditional short-read genome assemblers, such as Velvet or SOAPdenovo, cannot be directly applied to transcriptomes.
Any genome can be converted into a de Bruijn graph, as shown in the previous post. The graph may be large or small depending on how big the genome is, but its essential features are similar for all genome.
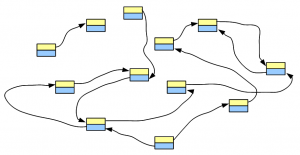
Let’s say, we have a genome, whose de Bruijn graph looks like the following figure -
We fragment the chromosomes uniformly and sequence the fragments using one of the popular short read technologies. Each tiny sequence, if converted into de Bruijn graph, will match part of the de Bruijn graph of the genome. For simplicity of discussion, we assume no sequencing error in the reads. Effects of sequencing errors will be considered in a later post.
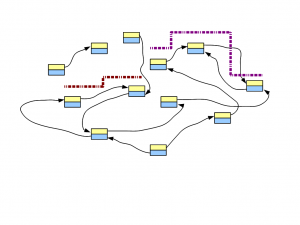
In the following figure, two short reads are displayed in red and purple. The regions of de Bruijn graph matched by those short reads are also shown.
Think about this conceptually - if we sequence billions of short reads uniformly representing the entire genome and construct a giant de Bruijn graph from those short reads, that de Bruijn graph will look identical to the de Bruijn graph of the genome. Therefore, our challenge will be to go back to the genome sequence from its de Bruijn graph.
Let’s say we keep track of how many short reads match each node, while constructing the de Bruijn graph. If the genome has no repeat and the sequencing is done with perfect uniformity at a depth of 50, each node in the de Bruijn graph will be visited by exactly 50 short reads. In that case, it will be trivial to reconstruct the genome sequence from the above de Bruijn graph.
In the real world, all genomes have repetitive regions and all short read libraries have some error. Resolving them is the major problem tackled by various short read assembly algorithms.
Speaking of repeats, here is an interesting observation. If almost all nodes of the de Bruijn graph are visited by 50 short reads, but a small subset of nodes visited by 200 short reads, one can argue that the underlying sequence near those subset of nodes constitute repetitive regions of the genome, and they are present 4 times in the genome. So, instead of avoiding repeats, as done by traditional assemblers, de Bruijn graphs allow one to estimate the repeat frequencies of repetitive regions during assembly.
The above observation brings us to the topic of genome assembly versus transcriptome assembly. In a short read library of a genome, all regions of the genome are represented uniformly. Therefore, if some K-mers have high occurrence, they are likely from repetitive regions of the genome. On the other hand, if some K-mers have low occurrence, they likely originate from sequencing errors. For convenience and simplicity, many short read genome assembly programs tune themselves to K-mers with average frequency (equal to sequencing depth, 50 in the previous example) and reject K-mers with very high or very low frequencies.
If you think about about de Bruijn graph of a transcriptome, it is inherently non-uniform due to expression levels of various genes. K-mers with very high occurrence may come from highly expressed genes and K-mers with low occurrence may come from low abundance genes. Those extremes are what make transcriptome data most interesting. If a genome assembly program removes K-mers from with extreme abundance on two ends, it cannot properly show variation in gene expression. That is why genome assemblers need to be modified for transcriptome assembly.