
On Global Warming
Over the last few weeks, we were trying to learn as much about global
warming climate change as possible. Many biology papers mention the
impact of global warming climate change on bioshere, and naturally
we wanted to understand the phenomenon from the first principles.
If you go past all popular-level debates and get to nitty-gritty details, you will find that the climatologists built very sophisticated models to forecast future temperature of earth over the next 100 years. That was very exciting. We love complex mathematical models.
Looking further below the hood, we found that the global climate models came in different flavors - HadSM3, HadAM3P, FAMOUS, HadRM3P, etc. At their heart, they all simulated Navier-Stokes equation using finite difference or spectral method, and simulated the relative behavior of oceans, ice sheets, wind, radiation, humidity, etc. over a long period of time. One thing for sure, they are very sophisticated. Did I use the word already?
We even downloaded a publicly available simulator to run our own calculations. That is where things went downhill. We will elaborate on that later, but here is a hint. EdGCM is described in its manual in the following manner.
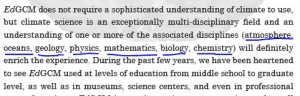
You can see that climate science is very multidisciplinary bringing together knowledge gathered over the decades in all domains of science. Do you find anything missing?
Getting back to climate models, one common feature of them is the following forecast in trend of global temperature over the next 100 years. The slope changes between model to model, but the trend remains identical. We decided to dig down further to understand that part of the forecast.
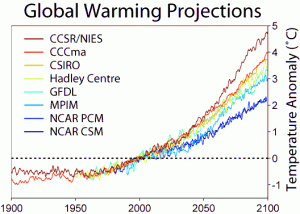
The above chart is from wikipedia, but it is based on a similar figure in the IPCC report (Third Assessment Report of the Intergovernmental Panel on Climate Change). You cannot understand the figure without looking into its caption. So, let us reproduce the entire wikipedia figure with caption.
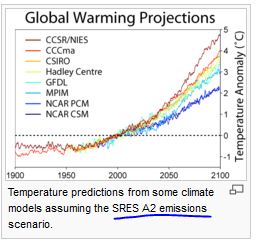
Those four words ‘SRES A2 emissions scenario’ are the most important ones in various global warming forecasts. What are they? They represent predicted future economic and population growth over the next 100 years !! IPCC reports have six scenarios (A1FI, A1B, A1T, A2, B1, and B2) for future economic growth over the next century or so. More details on various scenarios and their ‘story-lines’ can be found here.
Let us explain how the temperature predictions from the simulators work in more detail. The simulation starts with a forecast of future economic growth rate, and translates it into growth rate of carbon dioxide in the atmosphere. For example, the following chart shows the predicted carbon dioxide content over the next 100 years based on A1 scenario. It is primarily a function of economic growth rate. The data for the following figure were obtained from our downloaded free simulator.
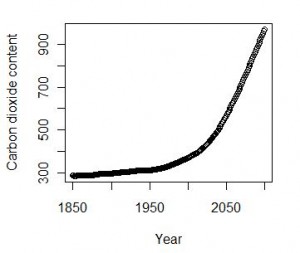
Based on growth rate of carbon dioxide, the models compute future temperature trend. Replace one economic scenario with another and you have different growth rate of carbon dioxide accumulation and different temperature trend over the next 50 or 100 years. Do you understand what is going on? The temperature forecasts are essentially economic forecasts over the next 100 years !!
That got us even more excited. Regular readers know that we have an outstanding track record of forecasting economy. In 2005, we predicted crash in housing bubble and subsequent global economic depression mimicking the 1930s. So, we decided to find the IPCC scenario that reflects our forecast. As it turns out, IPCC scenario A1 represents rapid economic growth of 3.6% in global GDP over the next 50 years, whereas the most pessimistic B2 represents less rapid economic growth of 2.8% over the next 50 years. There is no possibility of shrinking GDP anywhere. In contrast, data on US gasoline usage shows peak usage in 2007 and sharp decline since then -
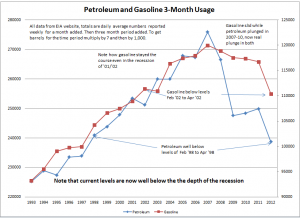
[Chart is borrowed from Mish’s economic blog]
Similar trend will be seen in global usage, when the economic depression goes global.
In conclusion, we found that global climate models are essentially economic forecasters over the next 50 or 100 years, and are created by people who do not even know whether their countries will remain solvent next year.