
Nanopore Updates from David Eccles
Reader David Eccles has been kind enough to keep us regularly posted on his progress with Oxford Nanopore sequencing. To make sure his helpful posts do not get lost in the comment section, we are creating a separate post as a collection of all his comments at different places in our blog. Readers are especially encouraged to see the last two comments, where he presented analysis of his own data and R codes for others to play with the data. David, please feel free to add additional comments to this thread so that others can follow them in order.
-—————————————————–
His first comment on 9/9/2014 -
As a participant of the MinION access programme (MAP), I have agreed to not report on technical information on the MinION sequencer (and specifically the control lambda DNA samples sent to us by Oxford Nanopore) until our laboratory has decided that the results were getting from the device on our own data are acceptable to us. Thats the main reason theres such a dearth of information at the moment, and the main reason why its difficult for me to discuss the details of sequencing.
Invitations to the programme were given in February 2014 (i.e. this year), and the registration process (including paying money and validating that software was working okay) was complete for most people by May 2014. While we were initially told this would be a 6-week process, it has stretched out to be much longer than that, and it is only now that the second wave of participants are coming into the programme.
I expect that we were one of the last labs in the first wave of participants to receive our first sample kits, and weve had issues with sample preparation such that we havent yet had an acceptable run with our own data (mouse mitochondria). Our lab in New Zealand had shipping issues due to various reasons, and we werent able to do our first run until around mid July 2014.
Since then, there have been only a couple of dribbles of data from people who have self-certified and consider the MinION good enough for their uses. The most recent that Im aware of is a video recording that Nick Loman made of a 2-hour sequencing run. You can see the final read length histogram here:
The output files from that run has yet to be released, but it is possible to see from the video the following statistics:
[numbers are estimated from the event data produced by the software, and the number of mappable bases will be less than this]
About 45 Mbp of sequence were generated over the course of the run. The device produced a little under one read per second, so the mean [estimated] read length is about 7kbp. To reduce confusion slightly, the histogram shown in the MinKNOW program here is adjusted so that the bin height displays the summed length of sequences in each bin, rather than the number of sequences. As an example of interpretation for this run, sequence data was mostly generated from sequences that were about 20kbp long.
Im happy to answer questions about this, but be aware that I am a little bit restricted in that, and can only report on technical information that has been produced and release by other self-certified labs.
As an aside, what seems to be missed from much of this discussion is just how different this technology is. I consider it a disruptive technology, and as such, most of the applications for the MinION sequencer have yet to be discovered. Heres my rough summary of the human-visible parts:
The MinION is a small disposable device about the size of a muesli bar (or granola bar) that plugs into the USB port of a computer, with power for sequencing and fluidics provided by the computer and your pipette. Once samples are loaded onto the device, it will produce a continuous stream of electrical sensor data in real-time that is processed on the computer to identify DNA bases that are moving through each of the 512 pores. Based on a couple of published/released graphs that Ive seen (from Nick Lomans lab), the sequencer is producing 10-25M sequence events per hour. These events are converted by base calling software (currently uploaded to and downloaded from a cloud service) into base-space sequence, resulting in a near real-time production of generated sequence.
Unlike other DNA sequencers, there is no DNA amplification required to run samples on the MinION. Sample preparation is reduced to mixing by inversion, spinning down liquids using a fist-sized microcentrifuge, pipetting, and room- temperature incubation to carry out DNA processing reactions all stuff that could be done in an hour or so in the back of a Jeep.
Unlike other DNA sequencers, the MinION carries out sequencing by directly observing the DNA bases as they move through the detection pore; the sequencing process is observing the exact template strand of interest, rather than a synthesised copy. An electrical current is passed across the pore, and this changes depending on what type of base is moving through the pore at the time. The MinION produces a real-time trace of electrical signals for each pore, allowing the run to be stopped as soon as an interesting sequence is found, then re-loaded with a new sample and restarted.
Unlike other DNA sequencers, there is no limit to the length of sequences that are fed into the MinION [although sequences that are too long can get broken up by pipetting, so the recommended upper limit under standard use is about 50kb]. Instead of fragmenting DNA into hundreds or thousands of pieces prior to sequencing, much longer sequences can be used, allowing sequencing across regions of duplication or low complexity.
-—————————————————–
His second comment on the same day -
The technology has many similarities with Pacbio except that the readout here is electrical instead of optical and the sequencing instrument is tiny rather than huge.
I wouldnt discount the actual sequencing process. To reiterate one of my previous points, the MinION carries out sequencing by directly observing the DNA bases as they move through the detection pore. PacBio uses fluorescently- tagged nucleotides for sequencing, and requires strand synthesis to occur in order to determine sequence its still sequencing by synthesis. That means you cant tell the precise nature of the template strand because you have to plan in advance what to expect. This is not a particularly interesting distinguishing feature at the moment, but I expect it to become more useful in the future as others determine how different base modifications (or different bases) influence the pore signal.
Ignoring that, The signal part of the technologies comes down to another optical vs electrical fight (like weve already seen with IonTorrent vs MiSeq). All optical methods (so far) are a bit more complicated because they require modified fluorescently-tagged (or radiolabelled) nucleotides in order to carry out sequencing.
So, the obvious question would be how the signal quality of electrical readout is better than the optical readout that PacBio has.
This is, obviously, delving into technical details. At the moment all I feel comfortable with saying is that the quality of what Oxford Nanopore are able to produce internally is higher than what is being observed in the field. This is expected, and the whole point of the MAP Oxford Nanopore want to work out what needs to be done in order to get others to see the kind of results that they are seeing in-house. If youre interested in getting more detailed answers (or at least interested in asking similar questions), I suggest you attend or review the Google hangout thats happening in about 12 hours (not wonderful timing for you, unfortunately):
https://plus.google.com/events/c84plk0i44oitav9v68mdltas9s
Clive Brown is very aware of your post, and is likely to try to address at least some of the point you have raised in that hangout.
-—————————————————–
Doing a kmer analysis is a good idea Ill have to add that to my standard workflow. However it doesnt quite tell the full story about the error profile. Because the nanopore base calling is event/time based in an asynchronous fashion (like PacBio), its very prone to extra events and skipped events (i.e. INDELs).
Illumina has a much greater advantage here because they use reversible terminators for sequencing, which usually means that its one base sequenced per cycle for all spots on the flow cell. When the usually fails (i.e. failing to add a base, or adding too many bases), you get phasing errors and a drop in quality (hence the upper limit on sequencing length due to the accumulation of phasing errors).
Nanopore doesnt have issues with length the fifth base call is just as good (or bad) as the fifty thousandth, but you get less reliability because the template doesnt progress through the pore at a constant speed. A combination of better base calling (i.e. software) and better motor enzymes (i.e. wetware) might reduce those errors in the future, but I expect theyll never go away entirely.
-—————————————————–
Okay, so now that were self-certified, heres my take on it. Heres a base call frequency plot:
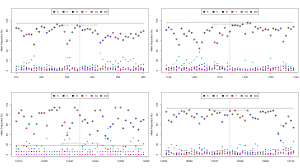
Each base call at each location is plotted in a different colour, and the reference base is circled. It demonstrates what ~25% base-call error looks like when the alternate error is fairly random errors for most non-reference bases are sitting at around the 5% level. There is a little deletion bias, but for SNPs the genotyping already works pretty well.
What I find very interesting is that almost all of this error is a software problem, and you can see quite clearly where the base-calling algorithms are lacking by generating raw trace data together with your run. In other words, the flow cell is great, the chemistry is great, the default sampling resolution is sufficient, but the base calling and event detection algorithms are a bit too immature to identify bases with high reliability.
Im still cleaning up my plots for that, but I should have something to show in a week or so.
You may also be interested in these probability tables (from a different run than that pictured, but similar results):
Reference Base Probability [sequenced base is the left-most column]
A C G T
A 0.95 0.022 0.014 0.014
C 0.055 0.877 0.021 0.048
G 0.097 0.069 0.743 0.09
T 0.02 0.035 0.016 0.929
i 0.366 0.239 0.116 0.279
d 0.342 0.287 0.124 0.247
Sequenced Base Probability [reference base is the left-most column]
A C G T i d
A 0.844 0.034 0.038 0.015 0.019 0.049
C 0.029 0.814 0.04 0.038 0.019 0.06
G 0.035 0.037 0.826 0.034 0.017 0.051
T 0.015 0.036 0.043 0.846 0.018 0.043
-—————————————————–
While Im still working out the best way to display the raw signal data, Ive finally been able to bundle it up into something that should be suitable for graphing. Due to file sizes, I currently only hava a file containing the event data + signal data for the first 6 reads from one of our experiments, but it should be good enough to get a feel for the data:
https://mega.co.nz/#F!zZAiWR7A!gF86n5f2YAHmaLsQTnMswA
The data is stored as an R data object (load using the load function of R), and contains the following information:
-
mtDNA reference sequence
-
base-called sequences
-
read type (template / complement / 2D)
-
channel# / read# / file#
-
event file name
-
scaling information for adjusting between raw signal and event data
-
event data
-
raw signal ranges corresponding to the event data
-
raw signal
I have excluded my mapping from base-called to reference sequence, because mapping is a very subjective thing.