
De Novo Transcriptome Assemblers – Oases, Trinity, etc. – IV
Assembly Algorithms of Trinity (and Oases)
We did not find much information on Oases algorithm in public domain except this small note at the Oases website -
Oases uploads a preliminary assembly produced by Velvet, and clusters the contigs into small groups, called loci. It then exploits the paired-end read and long read information, when available, to construct transcript isoforms.
The researchers, who wrote the program, privately told me that their paper is in review. So, we shall go ahead with explaining the Trinity algorithm today, and add on Oases, when, either their paper comes out, or I go through the code to figure out their approach.
Trinity is a de Bruijn graph based algorithm. We explained how a giant de Bruijn graph is constructed from millions of short read, and Trinity is no different in that first step. The elegance of Trinity algorithm is in resolving the giant graph into gene sequences.
When you think about de Bruijn graphs for transcriptomes, remember that they are different from the same for genomes in two respects -
i) transcriptomes are built from many short genes and the gene sequences do not contain much repeat. Therefore, the giant de Bruijn graph constructed for all reads of a transcriptome is essentially a composition of many small graphs, each representing a set of closely related genes. This makes the task of transcription assembler somewhat easier than a genome assembler.
ii) if a genome is sequenced 100x within a short read library, the K-mers from the short read will show a sharp peak around 100. This is because each part of the genome is present about 100 times in the library. On the other hand, in a transcriptome, genes can be present in various abundances. So, K-mer distribution of a transcriptome is not expected to show sharp peak at any number. Presence of genes at various frequencies makes the task of transcription assembler somewhat harder than a genome assembler.
Trinity takes advantage of (i) by partitioning the entire de Bruijn graph into many small disconnected graphs. Then, it fully assembles each small de Bruijn graph into proper sequences by taking care of alternatively spliced genes and other nuances. Trinity uses three modules for completing the task -
Inchworm
This is a greedy algorithm for resolving most abundant paths through a de Bruijn graph. Alternatively spliced genes are captured into multiple small sequence fragments consisting of dominant splice form and fragments of other less abundant form. So, expect to see 200,000 to 400,000 ‘genes’ at this step that will be resolved into much smaller count in the next steps.
Chrysalis
This part groups together Inchworm outputs into potentially related clusters based on k-mer analysis. Alternatively spliced fragments of a gene are all captured into one cluster. Chrysalis also pulls together corresponding reads for each cluster to perform detailed analysis.
Butterfly
This part of Trinity goes through each cluster of reads and gene fragments, analyzes their de Bruijn graph and determines the gene sequences present in multiple spliced forms.
Trinity paper in Nature Biotechnology is well written. So, instead of reproducing the details of the algorithm that you can read from the original paper, we shall present a simple example and discuss the outputs from various steps of trinity.
The following figure shows the de Bruijn graph of a transcriptome. In the graph, the nodes represent K-mers and the arrows connect those K-mers based on available reads. The solid black lines show how many reads support each path in the graph. If you remember our earlier discussion on how to construct de Bruijn graphs, you can immediately recognize that the top part of the graph (red, blue, green nodes) represents an alteratively spliced gene and the bottom part (yellow nodes) represents another gene.
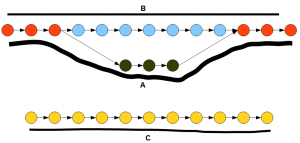
How does trinity simplify the above graph into genes? Inchworm first finds the node with the highest number of reads. It is one of the red or green nodes based on read distribution. Then inchworm extends on both side by picking the highest intensity nodes. So, essentially the more heavily transcribed branch of the alternatively spliced gene is picked. Inchworm removes all selected nodes and links from the de Bruijn graphs. When the same procedure is repeated until all nodes are removed, inchworm will find three segments - A, C and blue part of B. Note that the second branch of alternatively spliced gene is
Chrysalis takes the three segments determined by inchworm and clusters them into two groups that are related to two genes. Then butterfly reconstructs the full gene structures including alternate splice forms A and B.